Context Debugger
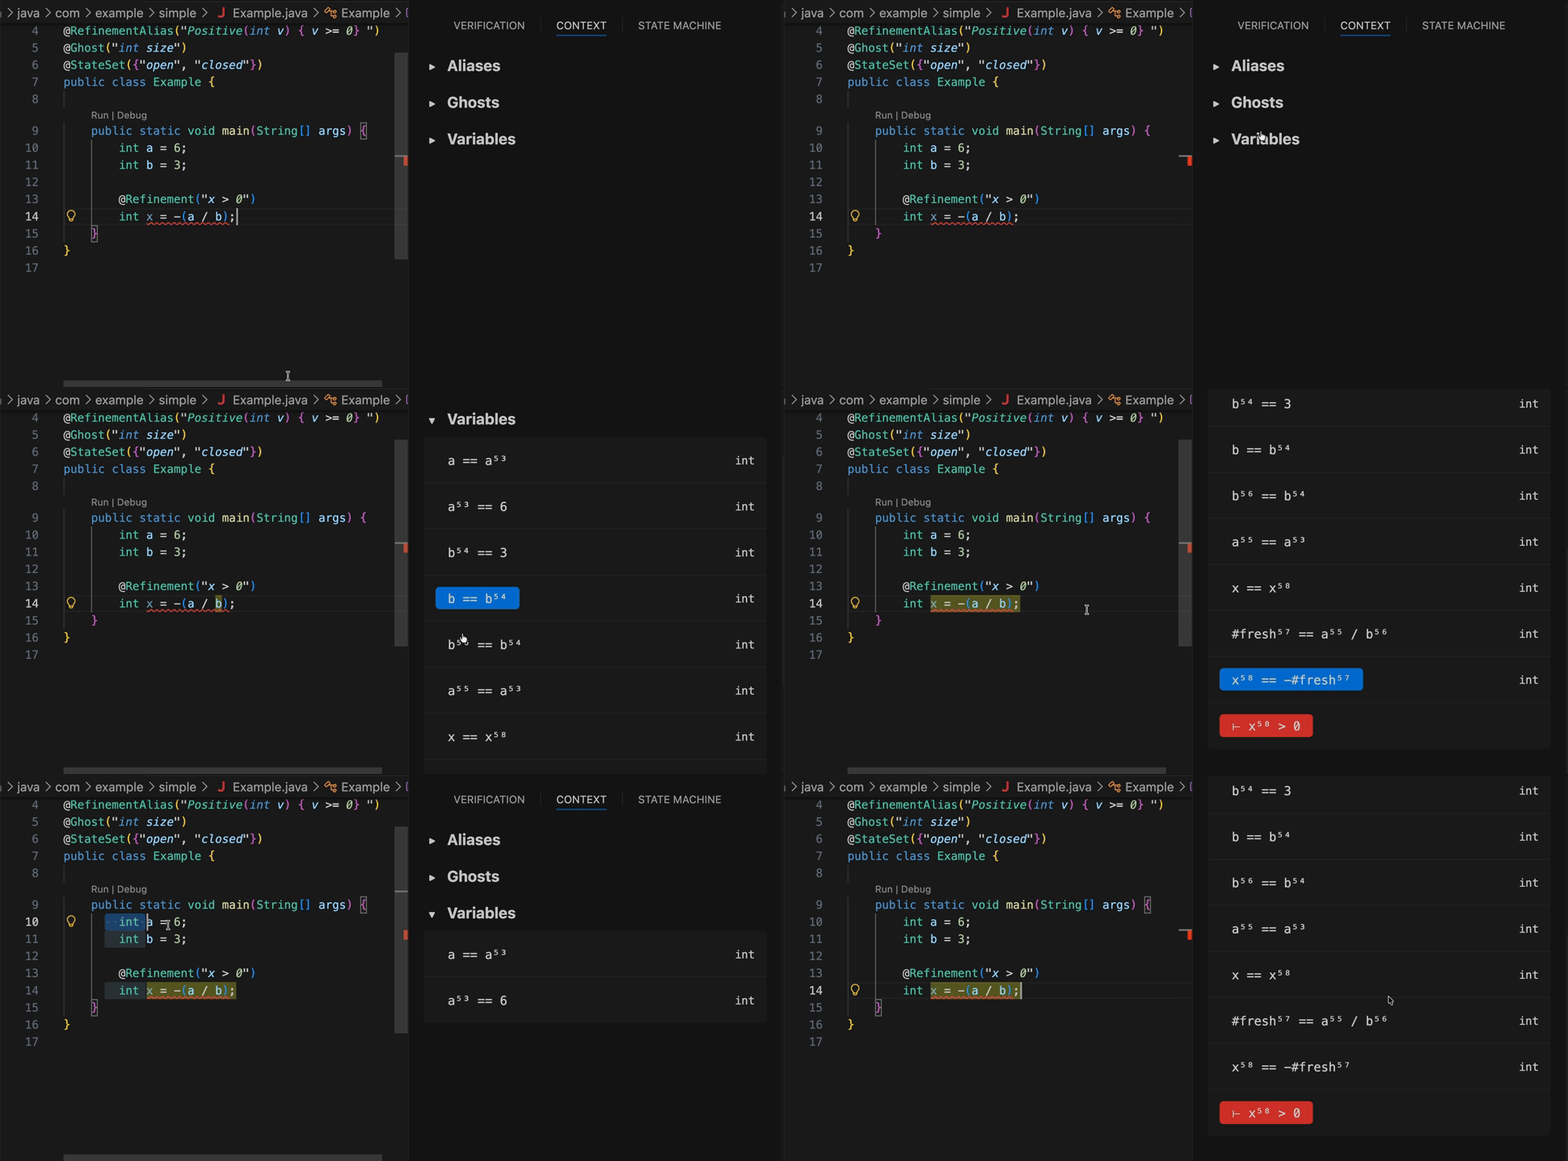
The context debugger exposes the verification context based on the current cursor position. Its goal is to make the invisible environment behind a refinement more explicit, so developers can see which names and assumptions are in the verification context.
The context debugger displays:
- Refinement aliases (globally)
- Ghosts and states (by file)
- Variables (by file and scope)
Cursor-Aware Behavior
The context debugger reacts to the current editor selection:
- With a single point cursor, it shows all variables in scope up to the cursor position
- With a selection, it shows all variables in scope within the selected range
This makes it easier to inspect the relevant context for a particular code region.
Variable Highlighting
Clicking a variable in the context debugger highlights that variable in the editor, which helps connect the displayed context back to the corresponding source code.
Failed Refinements
When a refinement or state refinement fails, the context debugger also shows the expected type in red after the turnstile (⊢). Clicking this expected type makes the webview navigate to the corresponding error in the diagnostic explorer.